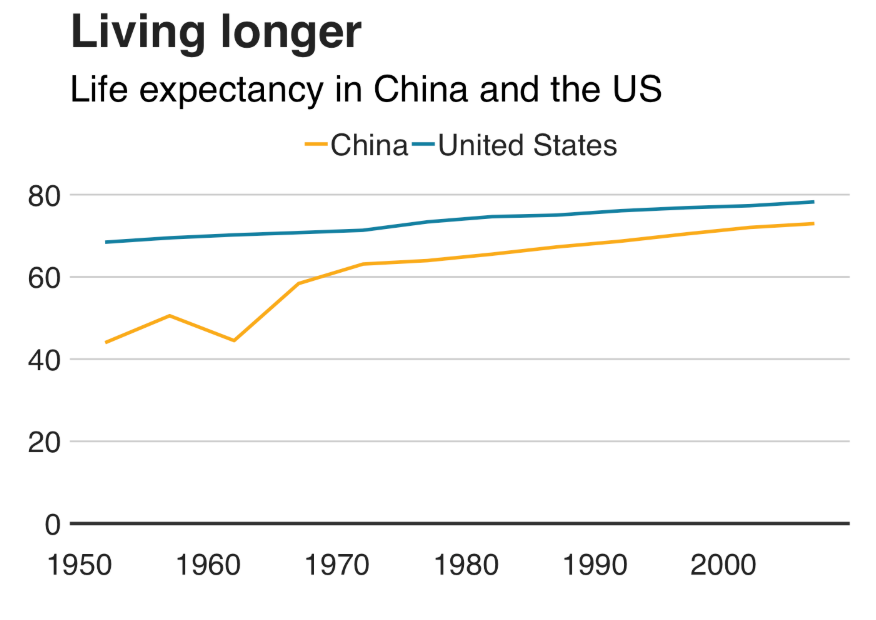
Multilines plots
# Prepare data
multiline_df = gapminder.query(
    'country == "China" | country =="United States" ')
# plotnine
multiline = (
    ggplot(multiline_df, aes(x='year', y='lifeExp', colour='country')) +
    geom_line(size=1) +
    geom_hline(yintercept=0, size=1, color="#333333") +
    scale_colour_manual(values=["#FAAB18", "#1380A1"])
+    labs(title="Living longer",
         subtitle="Life expectancy in China 1952-2007")
    +      bbc_style()
)
multiline
# plotnine
multiline = (
    ggplot(multiline_df, aes(x='year', y='lifeExp', colour='country')) +
    geom_line(size=1) +
    geom_hline(yintercept=0, size=1, color="#333333") +
    scale_colour_manual(values=["#FAAB18", "#1380A1"]) +
      bbc_style() +
    labs(title="Living longer",
         subtitle="Life expectancy in China 1952-2007"))
multiline
# altair
_range = ["#FAAB18", "#1380A1"]

multiline_altair = (alt.Chart(multiline_df).mark_line().encode(
x=alt.X('year', axis=alt.Axis(values=list(range(1950, 2020, 10)))),
y='lifeExp',
color=alt.Color('country', scale=alt.Scale(range=_range)))
.properties(title={'text': 'Living Longer',
                   'subtitle': 'Life expectancy in China 1952-2007'})
)

# hline
overlay = overlay = pd.DataFrame({'lifeExp': [0]})
hline = alt.Chart(overlay).mark_rule(color='#333333', strokeWidth=3).encode(y='lifeExp:Q')

multiline_altair + hline
