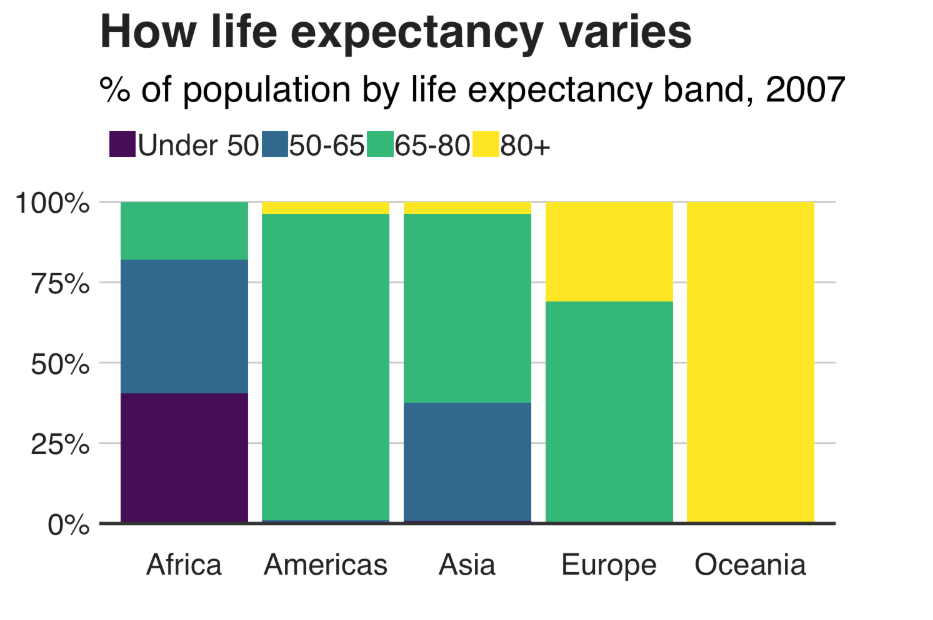
Stacked bar plots
# Prepare data
stacked_bar_df = (
    gapminder.query(' year == 2007')
    .assign(
        lifeExpGrouped=lambda x: pd.cut(
            x['lifeExp'],
            bins=[0, 50, 65, 80, 90],
            labels=["under 50", "50-65", "65-80", "80+"]))
    .groupby(
        ['continent', 'lifeExpGrouped'], as_index=True)
    .agg({'pop': 'sum'})
    .rename(columns={'pop': 'continentPop'})
    .reset_index()
)
stacked_bar_df['lifeExpGrouped'] = pd.Categorical(stacked_bar_df['lifeExpGrouped'], ordered=True)

stacked_bar_df.head(6)
# plotnine
stacked_bar_ggplot = (
    ggplot(stacked_bar_df,
           aes(x='continent',
               y='continentPop',
               fill='lifeExpGrouped')
           ) +
    geom_bar(stat="identity",
             position="fill") +
      bbc_style() +
    scale_y_continuous(labels=lambda l: ["%d%%" % (v * 100) for v in l]) +
    scale_fill_cmap_d() +  # scale_fill_viridis_d
    geom_hline(yintercept=0, size=1, colour="#333333") +
    labs(title="How life expectancy varies",
         subtitle="% of population by life expectancy band, 2007") +

    guides(fill=guide_legend(reverse=True)))

stacked_bar_ggplot
stacked_bar_df.head(10)
# altair
stacked_bar_altair = (
    alt.Chart(stacked_bar_df)
    .mark_bar()
    .encode(x='continent:N',
            y=alt.Y('continentPop', stack='normalize',
                    axis=alt.Axis(format='%'),
                   sort=['80+', '65-80', '50-65', 'under 50']),
#                 order=alt.Order(
#       # Sort the segments of the bars by this field
#       'lifeExpGrouped',
#       sort='descending'),
            fill=alt.Fill('lifeExpGrouped:O',
                          scale=alt.Scale(scheme='viridis',
                                          reverse=True,
                                          domain=['under 50','50-65', '65-80', '80+', ],
                                         range=['rgb(253, 231, 37)',
                                                'rgb(53, 183, 121)',
 'rgb(49, 104, 142)',

 'rgb(68, 1, 84)']),
                          legend=alt.Legend(title="Life Expectancy")

                         )
           )
    .properties(title={'text': 'How life expectancy varies',
                       'subtitle': '% of population by life expectancy band, 2007'},
                )
)

overay = overlay = pd.DataFrame({'continentPop': [0]})
hline = alt.Chart(overlay).mark_rule(
    color='#333333', strokeWidth=2).encode(y='continentPop:Q')


(stacked_bar_altair + hline).configure_legend(orient ='right')
