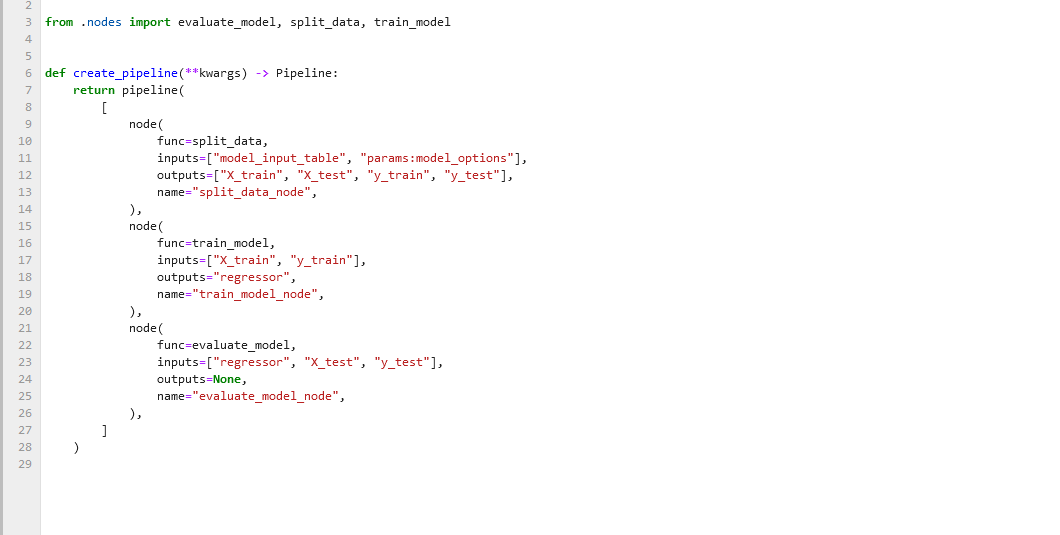
from kedro.pipeline import node

def foo(a,b):
    c = a + b
    return c

node(foo, inputs=["transaction_data", "customer_data"], outputs=["output_data"], name="my_node", tags="s")
Node(foo, ['data_a', 'data_b'], ['output_data'], 'my_node')The blog will cover the development of a new feature focused on enhancing the debugging experience for Kedro, a Python framework for building reproducible, maintainable, and modular data pipelines. This feature aims to streamline the debugging process by leveraging Jupyter notebooks and the inspect module to quickly restore the context of errors encountered within Kedro pipelines.
Debugging complex data pipelines can be challenging, especially when errors occur deep within the pipeline. Traditional debugging methods often involve many manual steps, which can be cumbersome and time-consuming. By introducing a feature that integrates seamlessly with Kedro and Jupyter notebooks, it provides a more interactive debugging experience, we aim to improve the productivity and efficiency of Kedro users.
Functional Requirements: - Seamless integration with Jupyter notebooks - a line magic or cell magic - Automate steps to generate the code to run a Kedro Node.
Nice to have: - Able to usein IPython terminal, can be used with debugger.
In-scope: - Integration of the feature with Jupyter notebooks. - Mapping of node inputs to function inputs using the inspect module. Out-of-scope: - Two way conversion between Notebook and source code. - Handle nested function definitions - that is a user defined function calling another user defined function which could be arbitary level of depth.
The challenge lies in mapping Kedro specific components to generate code that can be explored interactively in notebook to provide a seamless debugging experience. There are few key components that need to be mapped: - Generate code cell in Notebook - Loading the “Datasets” from a Kedro DataCatalog - Mapping Kedro Node’s to Python function. - A way to execute the code in the notebook - Import statements
Originall
Kedro Node is a thin wrapper around Python function, with optional metadata such as name or tags to organise the node in a meaningful way. They are not too important for this particular feature, but useful for filtering pipeline. Kedro has a first party plugin kedro-viz that provide an interactive visualiation of your pipeline.
from kedro.pipeline import node
def foo(a,b):
c = a + b
return c
node(foo, inputs=["transaction_data", "customer_data"], outputs=["output_data"], name="my_node", tags="s")Node(foo, ['data_a', 'data_b'], ['output_data'], 'my_node')You can see how close the node resembles a typical Python function. The inputs and outputs refer to the name of a dataset of the Kedro DataCatalog. It is basically the key value of the definition of a dataset, which is ususally defined in YAML format.
This is an example of the definition of a dataset:
transaction_data:
  type: pandas.CSVDataset
  filepath: data/01_raw/my_raw_data.csv
DataCatalog handles the I/O for Kedro Pipeline, the node only need to declares what data does it needs. The requirements here is that we need to map the inputs to dataset name properly. i.e. - transaction_data -> a - customer_data -> b
To run this in a notebook, we need to load the data and call the function.
a = catalog.load("transaction_data")
b = catalog.load("customer_data")

foo(a, b)
It’s fairly easy to map this particular example, but it becomes tricker if we need to handle *args, **kwargs, optional arguments and more. This is the syntax that Kedro Node support.
def bar(a, b, c, *args, d=None):
    return "bar"
Consider this function, both node definitions below are valid: - node(bar, ["transaction_data", "customer_data", "sales_data", "salary_data"], ["output_data"]) - node(bar, ["transaction_data", "customer_data", "sales_data"], ["output_data"])
The solution of this is using inspect module to get the information about the function signature and node, and map it carefully with inspect.Signature.bind.
There are 2 variations that we considered: 1. Code cell with the function defintion 2. Function call
Reusing the foo function mentioned earlier, with approach 1, we want to flatten it to a code cell in notebook
def foo(a,b):
    c = a + b
    return c
Notebook cell:
a = catalog.load("transaction_data")
b = catalog.load("customer_data")

c = a + b
c
The benefit of this is user can split the cell to inject logic or inspecting variable easily. However, it becomes increasing challenging to retrive the function body only. inspect provide method to extract the definition of foo, which is a string representation of this:
def foo(a,b):
    c = a + b
    return c
In order to make this runnable in a notebook cell, we need to handle a few things: 1. Remove the def line, which could be multiple lines 2. Remove the return statement, because it is not valid outside of function.
Again, it looks trivial at first, but if we start consideing multiple return in a function, it becomes unclear what we should do. In addition, a function could have decorator, which means removing the def isn’t always desired. At the end, we go with approach 2, which copy the function definition and make a call to it.
The notebook cell now look like this:
a = catalog.load("transaction_data")
b = catalog.load("customer_data")

def foo(a,b): # Not necessary to copy
    c = a + b
    return c

foo(a, b)We take a fairly simple approach for this. Using inspect.getsourcefile(function), we can retrive the file that contains the function we desired. After that, we parse the file and retrive all import statements with specific keywords.